Market Analysis
Nearly two-thirds of the queue never gets built
America's interconnection queue looks enormous. Most of it will never get built.
Insights
Queue analysis, developer forensics, PPA pricing and market structure across North American power markets. With the filings behind them, so you can cite them.
America's interconnection queue looks enormous. Most of it will never get built.
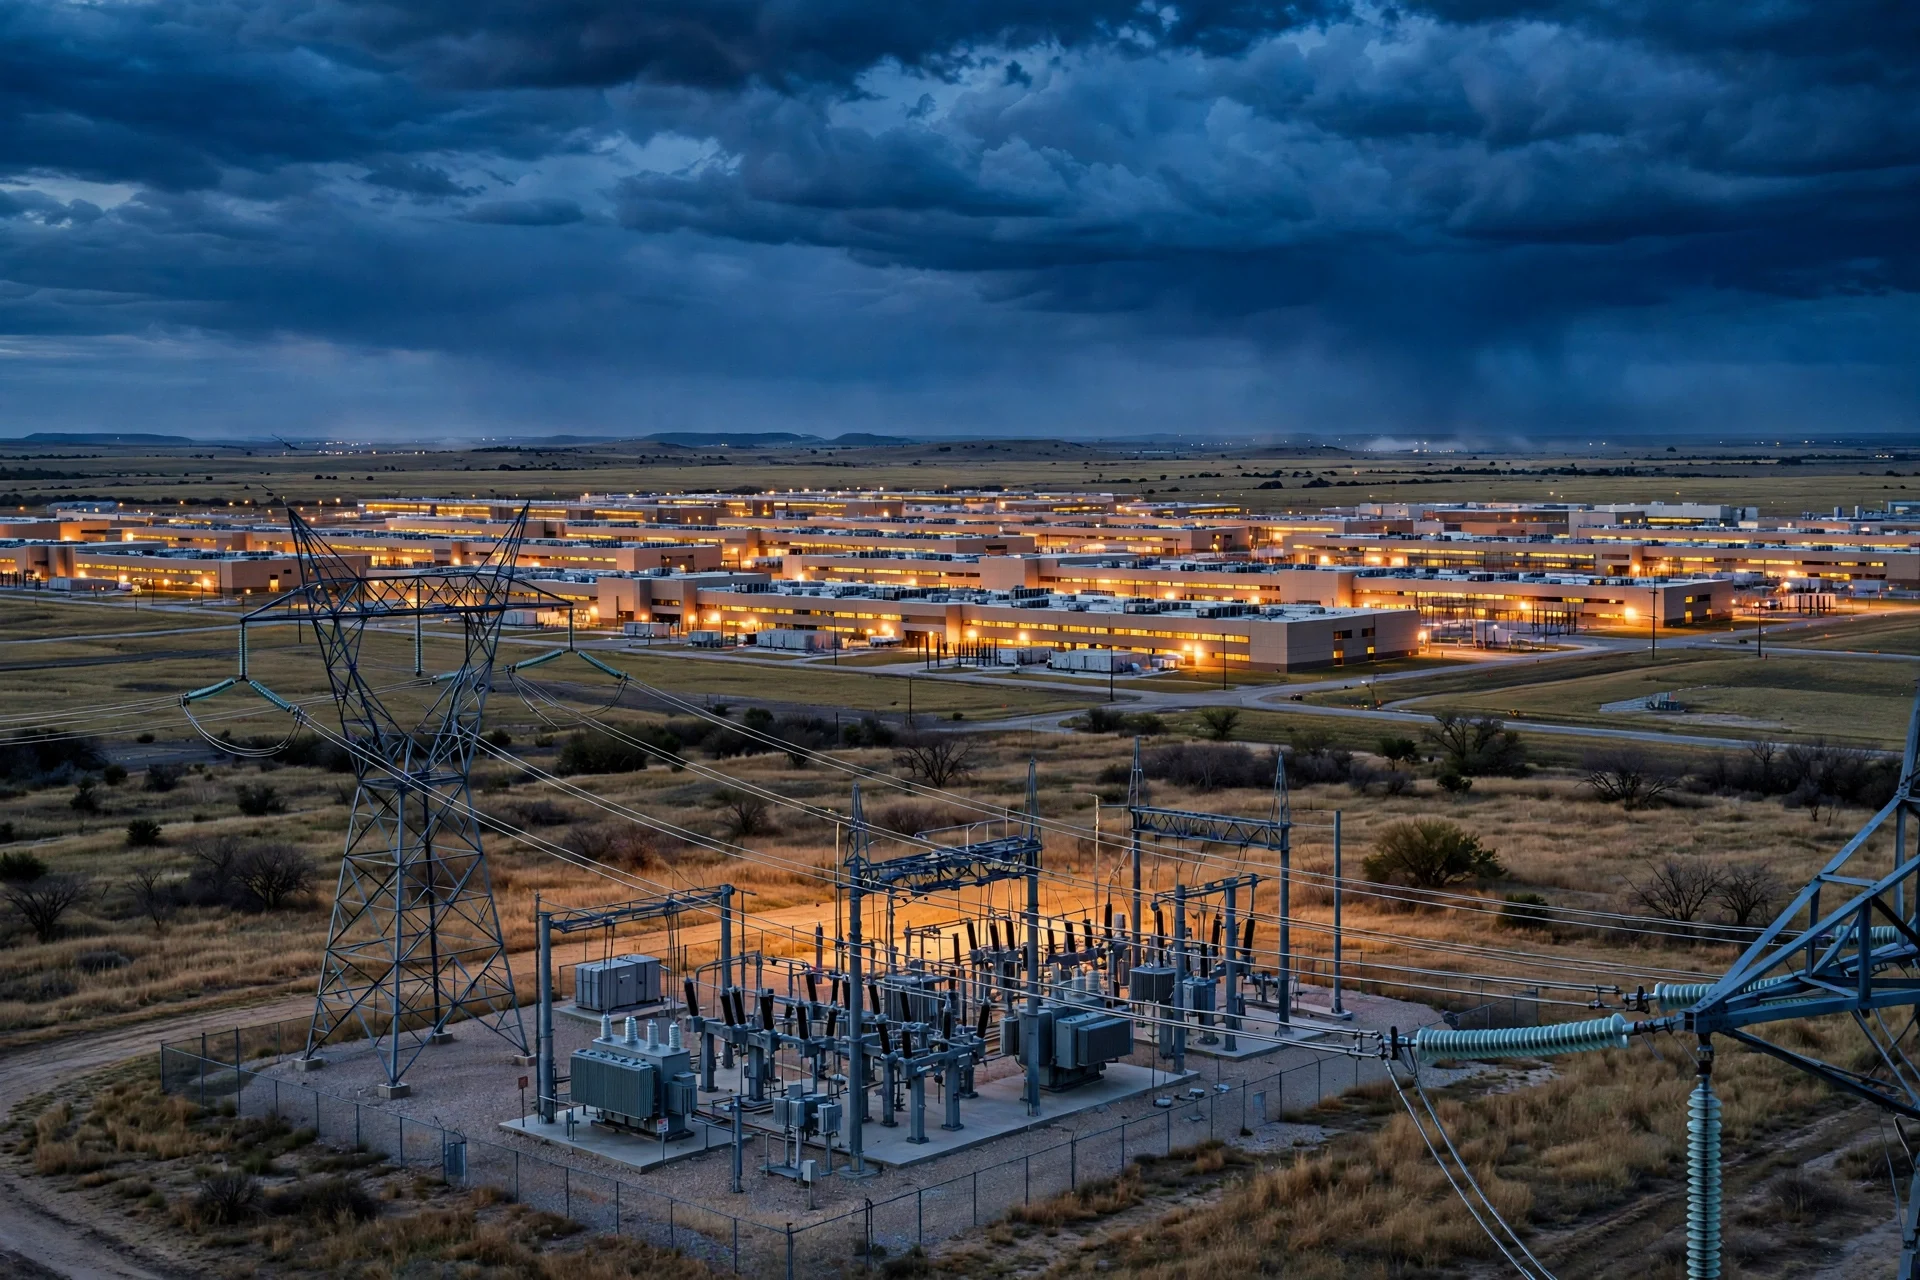
Texas is the clearest picture of the data center power problem, because Texas counts it in public.
What Buyers Actually Pay: PPA Prices Hidden in FERC EQR Filings By Load Factor Team Ask what a power purchase agreement costs and you will get three different answers, all called a PPA…
The Buildable Queue: Signed IAs, Study Stage and Developers That Finish By Load Factor Team The United States ended 2025 with about 2,061 gigawatts of generation and storage actively seeking…
California's offshore wind pipeline is shrinking one buyout at a time, and the gigawatts leaving have no replacement named.
FERC rejected PJM's IRAS large-load framework but approved a facility-level load registry. MISO wants a 120-day study track. What it means for interconnection queue data.
California's next interconnection window opens October 1, 2026, and it comes with a structural cost advantage no other US market offers.
On September 21, North Carolina regulators denied Duke Energy a permit for a 250-MW gas turbine meant to power Amazon's $10 billion data center campus. Three Republican appointees voted no.
The most important new generation coming to the US grid over the next three years was never filed in an interconnection queue. It was filed in a decommissioning plan.
Oklo has asked FERC to force PJM to reinstate a 750 MW project that PJM withdrew from its first reformed interconnection cycle.
Texas paused pending data-center grid interconnections for a project-by-project audit. Here is what is in the 474 GW ERCOT review and what it means for developers.
MISO's fast-track lane has 58 projects totaling 29 GW racing to meet data center demand — 38 have already signed interconnection agreements. What the queue data shows.
Battery storage passed solar in US interconnection filings in 2021 and has led on capacity every year since. The year-by-year queue data, and why counts and megawatts disagree.
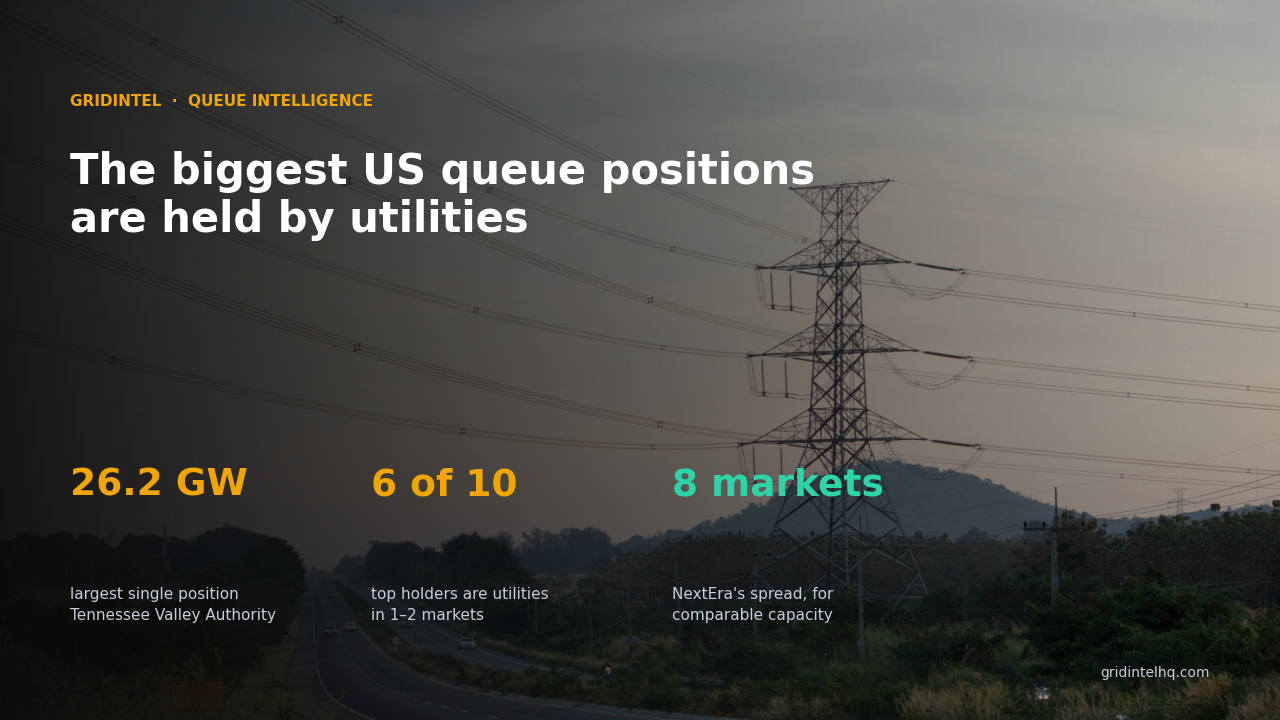
Ranked by capacity among Load Factor's highest-rated attributions, the largest US interconnection queue positions are held by utilities like TVA and PacifiCorp, not independent developers.
422 open flexibility programs from 190 US utility buyers across 49 states. Where they are, what they procure, and why none of it appears in interconnection queue data.
FERC's Electric Quarterly Reports contain 9.3 million PPA and contract records.
As of May 2026, CAISO's queue held 2,448 projects, including 1,099 battery storage proposals totaling 239,020.5 MW. See the scope of California's storage buildout and what's driving it.
Institutional investors and project finance teams are building queue-based deal sourcing workflows. Here's how the data is used, what signals matter, and where the methodology breaks down.
The US solar development market is consolidating. Here's a data-driven look at the M&A trends, which developers are acquiring, and what it means for the interconnection queue.
As of May 2026, ERCOT had 3,285 queue projects, and one state's public records cover all of them. See who's building Texas wind, solar, and storage.
Load Factor tracks 328 renewable energy M&A transactions with 992 evidence records. See which ISOs, fuel types, and deal structures are driving deal activity in 2026.
County parcel records reveal who optioned land for renewable energy projects years before construction. Here's how to use this public data source for developer research.
See how Load Factor identifies interconnection queue developers behind SPVs using 200,444 evidence records across 15+ source types.
ISO-NE's offshore wind pipeline spans Massachusetts, Connecticut, Rhode Island, and Maine. Here's who is developing, what's interconnecting, and the challenges ahead.
Transmission upgrade costs are the leading cause of renewable project death in US queues. Here's how interconnection cost allocation works and which markets are most affected.
See which developers hold the most solar MW in MISO's queue, where those projects are clustering, and how Load Factor verifies each attribution.
As of April 2026, PJM had 10,875 queue projects. See the backlog by fuel, state, withdrawal rate, and why developer identification is still unusually difficult.
Battery storage applications in MISO's queue have surged since 2022. Here's what the 2024–2025 data shows about which states, developers, and project types are driving growth.
NYISO's queue, 1,419 projects as of April 2026, is split between massive offshore wind procurements and upstate New York solar. Here's who is developing and what the pipeline looks like.
Battery storage interconnection queue data across 16 ISOs. See which markets, states, and queue years are driving the BESS wave.
FERC Order 2023 replaces serial interconnection studies with cluster processing. Here's what that means for project timelines, cost allocation, and developer strategy.
SPP's queue, 2,830 projects as of April 2026, reveals the dominant developers, states, and fuel types driving renewable growth across Kansas, Oklahoma, Nebraska, and the wind belt.
A handful of US counties account for a disproportionate share of renewable energy queue capacity. See which counties lead, why they attract development, and what county-level data reveals.
Across 41,692 US queue projects (as of April 2026), solar now dominates new applications while wind holds a larger share of operating capacity. See the fuel-type breakdown across all 16 ISOs.
Load Factor tracks 10,848 withdrawn US interconnection queue projects. See which ISOs have the highest withdrawal rates, why projects exit, and what active queue data really represents.
State Secretary of State LLC filings are a public record of every renewable energy SPV.
FERC Generator Interconnection Agreements (GIAs) are public documents that name project sponsors, transmission owners, and key project terms. Here's what to look for and where to find them.
EIA Form 860 is the most comprehensive public dataset of US power plant ownership. This guide explains what's in it, how to use it, and how it connects to interconnection queue research.
The US interconnection queue as of March 2026: 41,175 projects across 16 ISOs. See ISO counts, fuel mix, backlog trends, and where queue growth is concentrating.
Renewable energy developers use SPVs (special purpose vehicles) to isolate project risk, structure tax equity, and hold interconnection rights.
A walkthrough of the projects, developers and evidence in the markets you work in.
Queue movement, newly identified developers and the week’s deals, every Monday. Read past issues