Every project, in place.
Queue projects colored by technology and ringed by confidence, with the same filters as the project table. Find a developer, or search the area in view.
Map & grid · Load Factor Pulse
Projects, operating plants, data centers and transmission lines on one map, with every project’s location marked exact or approximate.
In the product
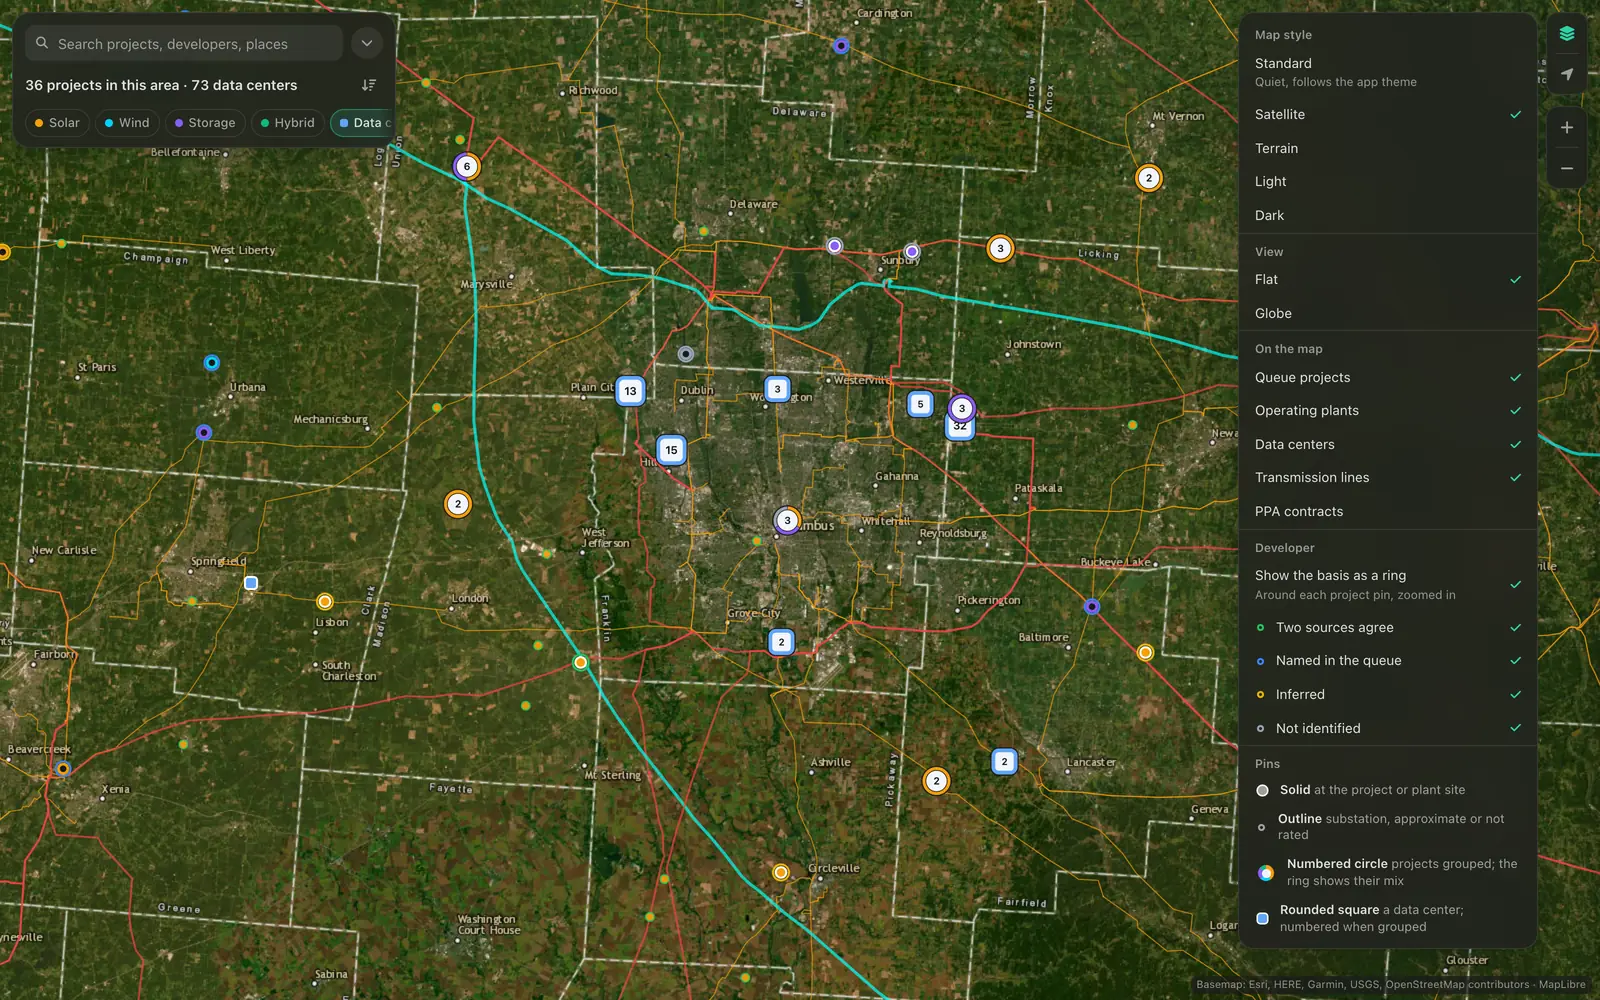
Queue projects colored by technology and ringed by confidence, with the same filters as the project table. Find a developer, or search the area in view.
Transmission lines by voltage, from 115 kV to 765 kV, operating plants and data centers. Current-day nodal prices and power contracts join them where your plan includes them.
Every project says how exact its pin is: the site itself, or an approximation such as its substation, ZIP code or county. Data-center pins say the same.
Screen any point on the map, or open a data-center page, to list nearby substations and transmission lines, with each line’s voltage and owner. Part of Load Factor Demand.
Covers all 16 North American markets Load Factor tracks, in the United States and Canada.
No, and Load Factor says so. Each project's map says whether its location is the project site or an approximation, such as the substation it connects to, its ZIP code or its county.
Transmission lines by voltage, operating plants and data centers, plus current-day nodal prices and power contracts where your plan includes them.
Yes, around a site. Screen any point on the map, or open a data-center page, to list the substations and transmission lines nearby, with each line's voltage and owner.
All 16 North American markets Load Factor covers, in the United States and Canada.
More in Load Factor
A walkthrough of the projects, developers and evidence in the markets you work in.
Queue movement, newly identified developers and the week’s deals, every Monday. Read past issues