Data Centers tab
Every site, ranked.
1,800+ sites in one table, filtered by market, operator, status and capacity, then opened on the map.
AI data centers ranked by compute, IT power or capital cost, from Epoch AI (CC BY 4.0).
Load Factor Demand
Data center sites on the same map as the interconnection queue, with the generation queued nearby and how much is likely to come online, year by year.
In Load Factor Demand today
Every site beside 38,000+ queue projects, withdrawn included. Any point on the map can be screened for supply.
What Demand answers
The load looking for power, and the generation looking for a buyer, on the same records.
The data centers around your queue positions, the operators behind them and the power they have already contracted for, from FERC filings.
The generation queued near a site, how much is likely to finish by year, the lines and substations around it, against your planned load.
The large-load pipeline by utility and ISO zone: sites announced, under construction and operating, with disclosed capacity and nearby supply.
Data Centers tab
1,800+ sites in one table, filtered by market, operator, status and capacity, then opened on the map.
AI data centers ranked by compute, IT power or capital cost, from Epoch AI (CC BY 4.0).
Site pages
Operator, owner and serving utility where a source names them, status, and how exact the pin is.
For AI data centers: facility power, compute, capital cost and build-out timeline, credited to Epoch AI.
Public-record facts
Who holds the land, what was permitted and which phases were filed, each with its source, date and link.
From state and county public records, utility filings and regulatory dockets.
Radius search
Pick a site or a point and a radius of 5, 10, 25 or 50 miles, or your own.
Queue projects, operating plants, substations, other data centers and the nearest priced grid node.
Power supply outlook
Could nearby supply cover the planned load? A first screen for any data center site, or any point on the map with a demand you enter. Not an interconnection study.
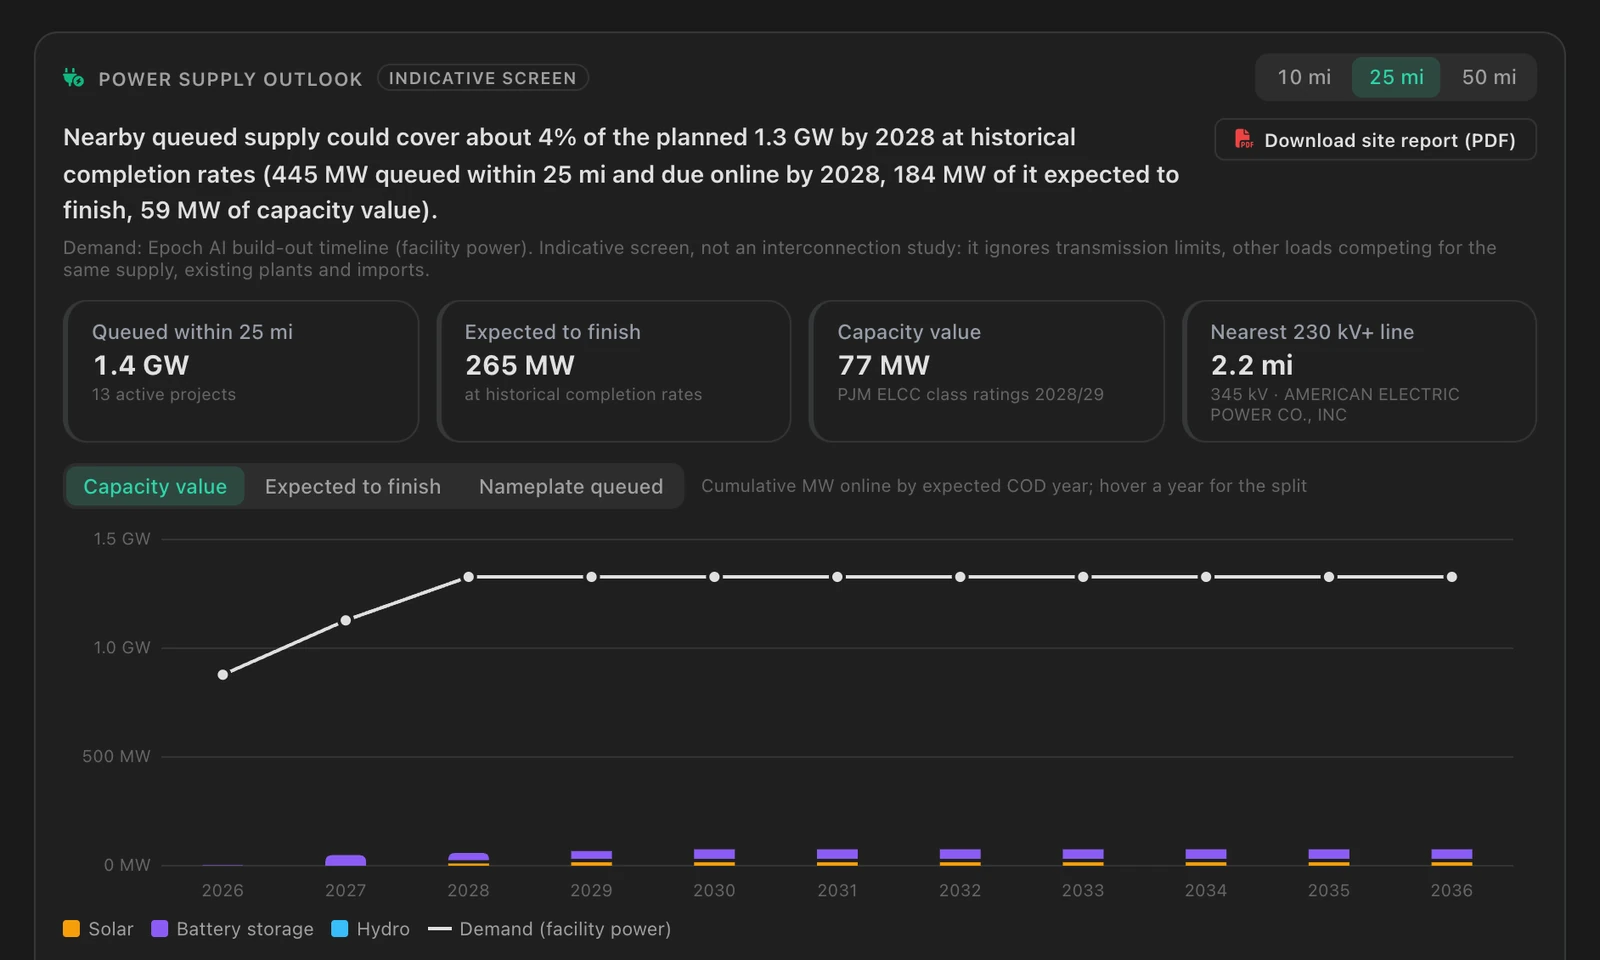
Indicative screen, not an interconnection study. It ignores transmission limits, other loads competing for the same supply, existing plants and imports.
The outlook on a one-page PDF, with the sources behind every figure, ready to share. Same caveat: an indicative screen, not a study.
In Pulse, a project’s notes name data centers within 25 miles in the same market. A nearby site is never called the buyer unless a deal says so.
Follow the demand
An operator’s power purchase contracts as a buyer, from FERC filings. For a queue project, the nearby operators that could buy its power.
Sites by serving utility and ISO zone, from announced to operating, with disclosed capacity and its source.
An alert when a site you follow changes. The weekly brief adds a section on data center moves.
How we know
A megawatt figure appears only where an operator, a utility or a filing disclosed it, with the source shown.
Shown only where a source published it.
Records collected automatically are held for review and labelled that way.
The labels and review rules of every Load Factor product.
The outlook points to where to look closer.
| Kind of source | What it adds |
|---|---|
| Open research data on AI data centers (Epoch AI) | Facility power, compute, capital cost and build-out timelines |
| Open map data (OpenStreetMap) | Data center sites and substations |
| State and local public records | Land, permits and other facts about a site |
| ISO & utility reports | The queue around each site, large-load requests, zones and territories |
| Federal filings and grid data | Transmission lines, operators’ power purchase history, published capacity ratings |
A snapshot. We read dozens of kinds of public source, and the list keeps growing.
Data center power, compute, cost and build-out data: Epoch AI, “AI data centers”, epoch.ai/data/ai-data-centers, licensed under CC BY 4.0. Map data © OpenStreetMap contributors, ODbL. Each site page lists its sources and their licences.
A walkthrough of the projects, developers and evidence in the markets you work in.
Queue movement, newly identified developers and the week’s deals, every Monday. Read past issues