Ask who is building America's renewable buildout and most people name developers — NextEra, Invenergy, Orsted. Rank the interconnection queue by capacity among Load Factor's highest-rated attributions and a different picture appears: the largest single position belongs to a federally owned utility, and half the top ten are regulated utilities building for their own service territory.
The top of the queue
Ranked by capacity among Load Factor's highest-rated attributions (from regulatory filings or project entity records) when this was written:
| Queue position holder | Projects | Capacity (GW) | Markets |
|---|---|---|---|
| Tennessee Valley Authority | 114 | 26.2 | 1 |
| NextEra Energy Inc | 143 | 25.2 | 8 |
| Arizona Public Service | 99 | 22.4 | 2 |
| PacifiCorp | 121 | 19.7 | 1 |
| Southern Company | 87 | 15.6 | 1 |
| NV Energy | 48 | 15.1 | 1 |
| Orsted | 34 | 12.1 | 7 |
| RWE | 59 | 11.7 | 3 |
| Entergy | 37 | 11.5 | 1 |
| Invenergy LLC | 54 | 11.0 | 6 |
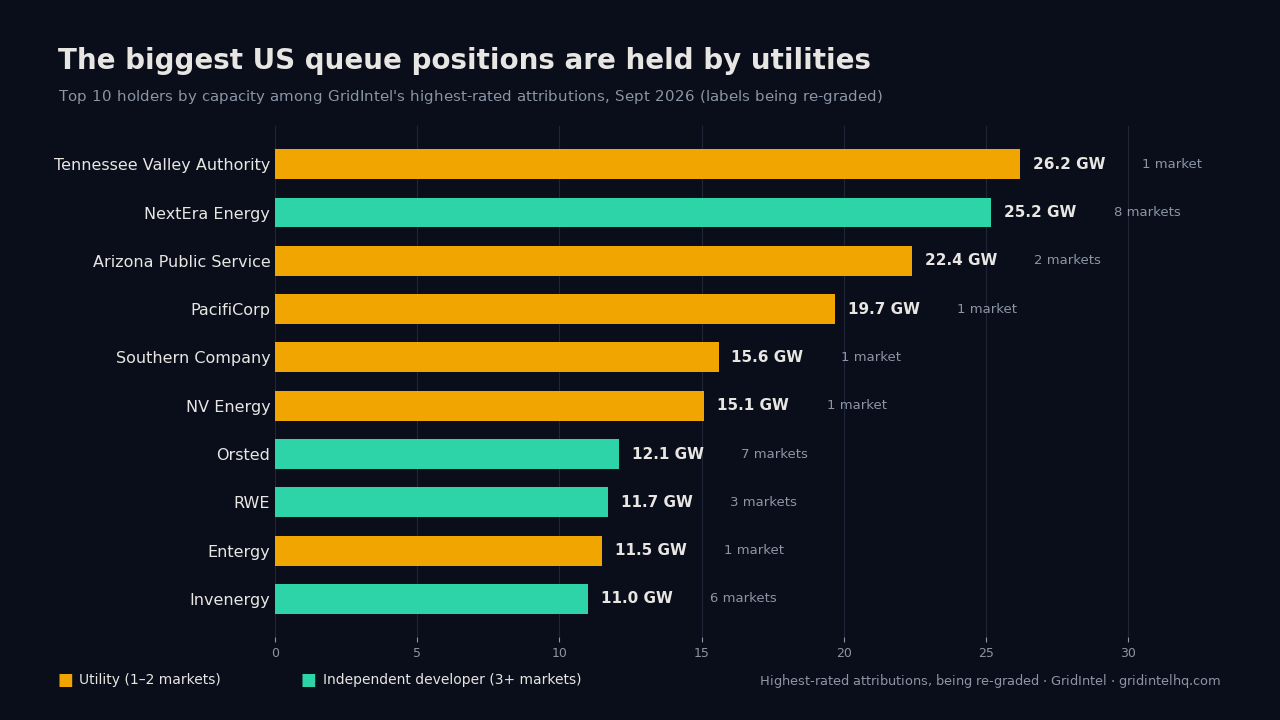
Two different species, one league table
The Markets column is where this gets interesting. The list is not one population — it is two, with opposite strategies, that happen to rank near each other.
Single-market utilities. TVA's 26.2 GW sits entirely in one market. So does PacifiCorp's 19.7 GW, Southern Company's 15.6 GW, NV Energy's 15.1 GW and Entergy's 11.5 GW. These are regulated or federally owned utilities procuring and building generation for territory they already serve. Their queue position is a function of load growth and resource planning, not commercial expansion.
Multi-market independents. NextEra's comparable 25.2 GW spans eight markets. Orsted operates across seven, Invenergy six, RWE three. These are developers going wherever the economics work, competing for position in markets where they have no captive customer.
Two firms can hold near-identical megawatts and be doing entirely different things. TVA at 26.2 GW in one market and NextEra at 25.2 GW across eight are not competitors in any meaningful sense — they barely overlap.
Why utilities are easier to see
There is a measurement caveat worth being direct about. Utilities are disproportionately easy to attribute. They file under their own names, appear in resource plans and rate cases, and rarely hide behind a project-specific LLC.
Independent developers do the opposite. A single project routinely sits inside a special purpose vehicle with a name that reveals nothing — Gipper Solar Farm, LLC tells you about a place, not a parent. Attribution requires linking that SPV back through state filings, FERC dockets, EIA records or press coverage.
So this table is a floor for the independents, not a ceiling. Their totals here understate their real positions by whatever share of their portfolios remains unattributed. The utilities' numbers are closer to complete. Read the ranking with that asymmetry in mind.
What it changes
If you sell into this market, the buying process behind 26 GW of TVA capacity looks nothing like the process behind 25 GW of NextEra capacity — one runs through integrated resource planning and regulatory approval, the other through commercial development teams and investment committees.
If you are analysing competition, single-market utility positions are not contestable in the way independent positions are. Counting them together overstates how much capacity is actually in play.
Based on Load Factor's resolved ownership data as of September 2026, limited to projects whose developer attribution then carried Load Factor's top confidence labels (from regulatory filings or project entity records); those labels are being re-graded against the two-source rule, so read the ranking as indicative. Projects with inferred or unverified attribution are excluded.