FERC's Electric Quarterly Reports (EQR) — submitted quarterly by every public utility, power marketer, and independent power producer that sells electricity in interstate commerce — contain approximately 9.3 million transaction records covering wholesale power contracts from 2013 through the present. Within that dataset are the power purchase agreements (PPAs) that link renewable energy generators to the utilities, corporations, and load-serving entities that buy their output. Analyzed systematically, the EQR is one of the best public data sources for understanding actual PPA market dynamics — who is selling to whom, at what prices, and in which markets.
The EQR is not designed for ease of use. The raw data is distributed as quarterly Parquet files through PUDL's S3 mirror, requires significant cleaning to remove duplicate records and standardize seller names, and covers only FERC-jurisdictional transactions — meaning ERCOT is partially absent, and vertically integrated utilities in non-competitive markets appear as buyers but not sellers. Despite these limitations, the EQR's breadth provides a market view that no commercial data vendor fully replicates.
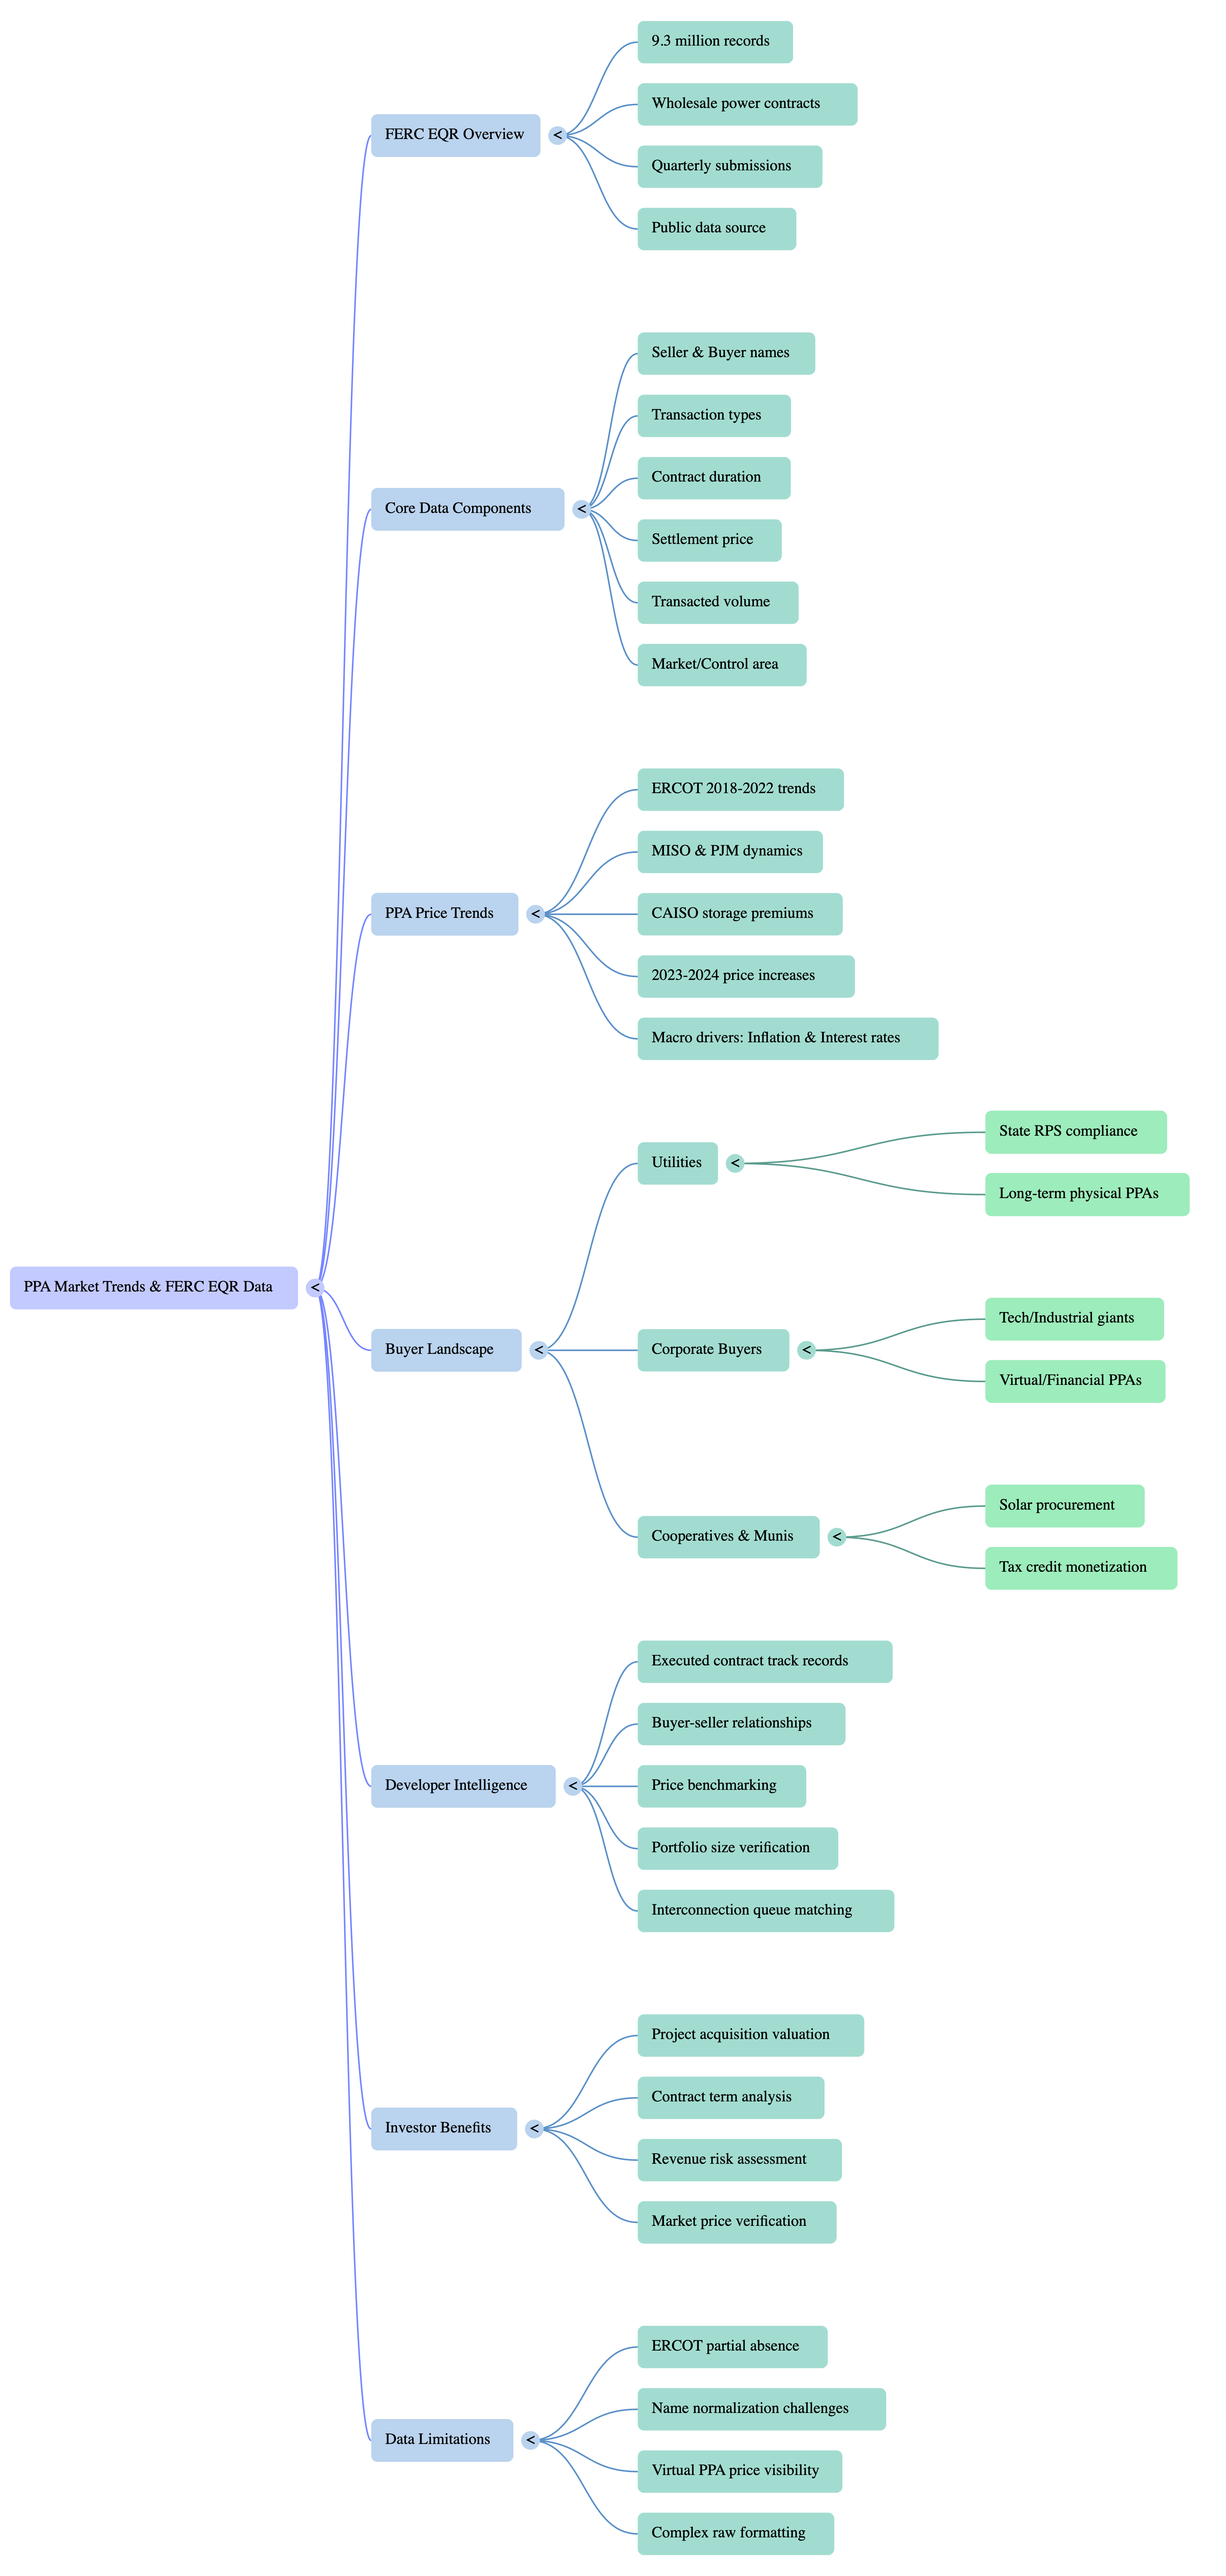
What the EQR Actually Contains
The core EQR transaction record includes:
- Seller name — the entity selling power, typically the project developer or its operating SPV LLC
- Buyer name — the purchasing counterparty: utility, corporate buyer, power marketer, cooperative
- Transaction type — energy, capacity, ancillary services, or combinations
- Contract duration — short-term (one month) through long-term (20+ years)
- Settlement price — the contracted or spot price, in $/MWh
- Volume — MWh transacted in the quarter
- Market/control area — the ISO or utility control area where delivery occurred
Long-term contracts (defined as contracts longer than one year) are filed with additional detail, including contract start and end dates, enabling researchers to identify the vintage and remaining term of active PPAs. Short-term and spot transactions are also filed, providing market price context.
The limitation to note: EQR prices for renewable energy PPAs are often reported at the wholesale settlement price, not the contracted strike price, if the contract is a financial PPA (virtual PPA or contract-for-differences). Under a virtual PPA structure, the generator sells power at spot prices and receives a fixed "strike price" from the corporate buyer as a separate financial settlement — a structure that is not always visible in EQR transaction records as a single integrated price.
PPA Price Trends from the EQR Record
The EQR provides the most comprehensive public view of renewable energy PPA price trends. Key patterns visible in the data:
| Market / Period | Solar PPA Price Range ($/MWh) | Wind PPA Price Range ($/MWh) | Key Driver |
|---|---|---|---|
| ERCOT, 2018–2020 | $18–$30 | $15–$25 | PTC phase-down, LNG competition |
| ERCOT, 2021–2022 | $22–$35 | $20–$30 | Post-Uri grid reliability premium |
| MISO, 2020–2022 | $25–$40 | $18–$28 | State RPS procurement, ITC step-down |
| PJM, 2021–2023 | $35–$55 | $28–$45 | Higher curtailment risk, DC offset, offshore premium |
| CAISO, 2021–2023 | $30–$50 | N/A (limited) | Duck curve storage premium, LCFS credit value |
| All ISOs, 2023–2024 | Up 15–25% vs. 2022 | Up 10–20% vs. 2022 | Interest rate increases, supply chain inflation |
The 2023–2024 PPA price increase reversed the decade-long trend of falling renewable energy contract prices. Rising interest rates increased the cost of capital for project finance; supply chain constraints increased the cost of modules, turbines, and balance-of-plant equipment; and inflation increased development costs. The EQR shows this shift in the prices that actually cleared — contracts signed in 2023 and 2024 are materially more expensive than those signed in 2020–2021.
Who Is Buying Renewable Energy PPAs
The EQR reveals a buyer landscape that has diversified dramatically since 2018. The historical pattern — utilities as the dominant PPA buyers, driven by state renewable portfolio standard (RPS) requirements — has been supplemented by a large and growing corporate buyer segment.
Utility buyers remain the largest PPA volume purchasers nationally. State RPS compliance drives procurement in Illinois, Michigan, Minnesota, California, Massachusetts, and most other states with renewable energy mandates. Utility PPAs are typically long-term (15–25 years), fixed-price or with modest escalators, and tied to specific delivery points within the utility's load-serving area. The EQR captures these transactions as long-term contracts between the generator LLC and the utility's procurement entity.
Corporate buyers have grown substantially. Technology companies (Amazon, Google, Microsoft, Meta), industrial manufacturers, and large retailers have collectively signed more than 100 GW of corporate PPAs in the US over the past decade. Most corporate PPAs are financial or virtual PPAs — the buyer does not take physical delivery at the project, but rather receives the economic benefit of a fixed-price contract for a notional quantity of energy. The EQR captures these differently from physical utility PPAs, as the power marketer intermediary (often the generator's trader) is the counterparty, not the corporate buyer directly.
Cooperatives and munis are a growing PPA buyer segment, particularly for solar. Cooperative utilities in the Southeast and Midwest are procuring solar under long-term PPAs rather than building their own generating assets, driven by falling solar costs and IRA tax credit transferability that allows co-ops to monetize tax credits they cannot use directly.
Using EQR Data for Developer Intelligence
For developer research, the seller side of the EQR is the relevant dimension. Sellers usually report under project LLC names, so the dataset becomes far more useful once each seller is tied to the queue project and the developer behind it. That connection reveals:
- Developer track record of executed contracts. A developer whose projects report contract sales to FERC has demonstrated the ability to reach commercial operation and execute offtake — a stronger signal than queue presence alone.
- Buyer relationships. Consistent buyer-seller relationships in the data (same developer selling to same utility across multiple projects) indicate an established procurement relationship that may extend to new projects under development.
- Price benchmarks by developer and market. EQR prices for a specific developer's existing contracts provide a benchmark for the contracted prices likely available to their next project in the same market.
- Portfolio size verification. Aggregating reported sales volumes by developer provides an independent check on reported operating capacity — useful for verifying claims made by developers seeking capital.
The identity challenge is real. Sellers frequently report under SPV LLC names rather than parent developer names, so the same care that goes into identifying a queue project's developer applies here: show the SPV exactly as filed, and name a parent only when a public record proves it. EQR data tied to verified developers is significantly more useful than raw EQR data.
Why This Matters for Developers and Investors
For developers, EQR data provides competitive intelligence on what prices are clearing in their target markets. A developer preparing to negotiate a utility PPA in MISO or SPP can use recent EQR transaction data from comparable projects to anchor their price expectations — and to identify whether the market trend is moving toward or away from their target contract price.
For investors evaluating project acquisitions, EQR data provides independent verification of the contracted price environment. A project claiming a $45/MWh PPA in a market where EQR data shows comparable transactions clearing at $35/MWh requires explanation — either the contract is above-market (favorable for the seller but potentially fragile if the buyer has termination rights) or the comparables are not truly comparable.
The EQR also provides the best available public data on PPA term lengths — the duration over which offtake revenues will be contracted. Projects with remaining contracted terms of 15+ years carry meaningfully less revenue risk than projects with 3–5 year terms or merchant exposure. This term structure is visible in the EQR's long-term contract filings and is a key input to any renewable project valuation.
Conclusion
FERC's EQR is one of the most information-dense public datasets in US energy markets — and one of the least used by market participants who have not invested in the infrastructure to access and analyze it. The 9.3 million transaction records it contains provide a ground-truth view of renewable energy PPA markets that benchmarks, surveys, and news coverage cannot replicate. The investment in learning to use it pays off for any analyst who regularly prices, sources, or evaluates clean energy projects.
For the interconnection context that determines which queue projects are likely to show up in EQR filings, see The US Interconnection Queue by the Numbers. For the M&A context that determines who ultimately owns the projects behind those records, see Solar Developer Consolidation: Who Is Buying Whom in 2024–2025.
Load Factor brings FERC EQR contract data together with project-level queue intelligence, so PPA history sits next to the developer behind each project. Sign in to access the integrated dataset.